

- USD/JPY trades near multi-decade highs as FED-BOJ policy divergence persists.
- Japan's weak GDP, soft consumption, and easing inflation continue to pressure the yen.
Table of Contents
- USD/JPY Live Chart
- USD/JPY Latest News
- USD/JPY Forecast 2026
- USD/JPY Forecast 2030
- USD/JPY Forecast 2040
- Bullish USD/JPY Scenario (Yen very weak): 200+
- Neutral Scenario: 165 – 185
- Bearish USD/JPY Scenario (Yen Strengthens): 130-150
- USD/JPY Historical Data
- USD/JPY Buy or Sell
- Best Time to Trade USD/JPY
- Tokyo-London overlap remains the prime trading window
- Secondary Opportunities
- Frequently Asked Questions
- How to calculate pips in USD/JPY?
- How to trade USD/JPY?
- What is USD/JPY?
- What time does USD/JPY open?
The USD/JPY is still watched very closely as the world‘s countries are all now entering a new interest rate-cycle. With the Federal Reserve remaining in a high-for-longer posture and Japan’s economy refusing to emerge from decades of low inflation and slow growth, so too does the dollar-yen exchange rate refuse to stop trading near multi decade highs. USD/JPY has been an a roller coaster ride in 2020 but where will it go next? Here is an analysis of technical and macro trends, past patterns, history and future forecasts with price predictions up to 2040.
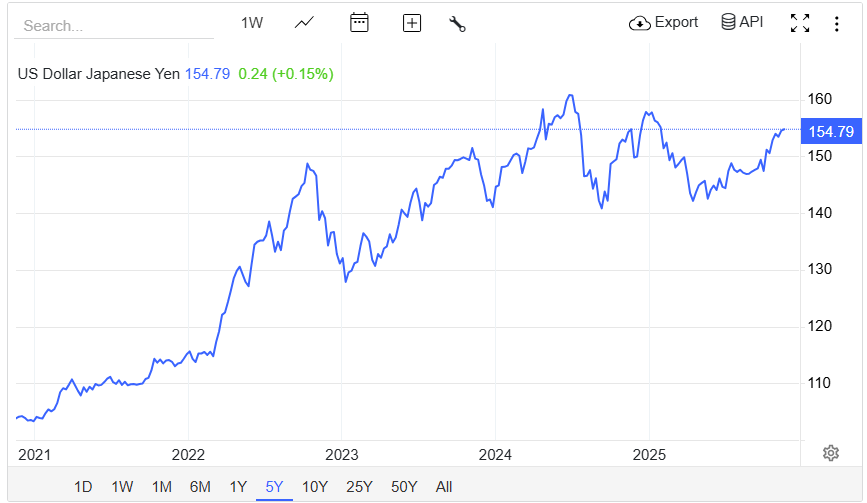
USD/JPY Live Chart
USD/JPY is currently trading near 154, holding sub-2024 multi decade highs. The parent maintains a clear bullish structure, with U.S. Treasury yields, proving well supported and yen softness being never far away. Price action continues to largely reflect both yield differential perceptions and the market’s lack of trust in the bank of Japan’s capacity to normalize policy substantially.
USD/JPY Latest News
It has had its economic difficulties reaffirmed via recent data releases. GDP slipped once more in Q3, consumer spending weakened, and inflation growth eased back, leaving little cause to expect the bank of Japan tightening policy too aggressively. Bank of Japan officials are worried that premature tightening could choke off fragile economic recovery.
The statement comes as a number of Federal Reserve officials have expressed their intention to keep rates tight under inflation clearly move towards the 2% target. Traders now price more gradual easing path for the Fed in 2025 – 2026. According to Bloomberg, this should keep the greenback bid and underpin USD/JPY.
USD/JPY Forecast 2026
The difference between Fed and Bank of Japan policies is likely to start of 2026 as wide as ever. If the Fed’s balance sheet reduction proceeds slowly while Bank of Japan remains slow to tighten:
- Base case: 158 – 162
- Bullish case: 165+, driven by higher U.S. yields.
- Bearish case: 150 – 155, possible only if Bank of Japan signals genuine tightening or Japan intervenes heavily in Forex market.
The market consensus is for Yen weakness to continue until Japan stages structural reforms, or aggressively campaigns against the weak currency.
USD/JPY Forecast 2030
Taking a longer view, then structural factors come more into play:
- Japan’s slumping productivity is constantly depressed by its aging population.
- So tepid is wage growth that is helping to inflation, which is keeping the Bank of Japan ultra-dovish.
- Tech-driven growth and higher yield in the U.S. economy are still relatively strong.
If that holds, USD/JPY is likely to float up into this 170 to 180 range by 2030. It needs to be stressed that FX cycles in such horizons are highly non-linear, but with the long run in balance between Japan and the US existing for decades, a very long-term depreciation should be considered.
USD/JPY Forecast 2040
Given the inherent uncertainty, the forecast for 2040, we need scenarios rather than point predictions:
Bullish USD/JPY Scenario (Yen very weak): 200+
- Japan is not getting out of deflation.
- Bank of Japan retains ultra loose framework.
- U.S. growth continues to outperform.
- Demographic decline accelerated in Japan
Neutral Scenario: 165 – 185
- Japan’s inflation is steadying but economic growth is still feeble.
- Bank of Japan normalizes gradually.
- The U.S. dollar still dominates the reserves.
Bearish USD/JPY Scenario (Yen Strengthens): 130-150
- Japan achieve a structural reform.
- U.S. debt trends pushed the dollar to the downside.
- Bank of Japan fully exit YCC and hike rates significantly.
Currently, the former two scenarios are considered more plausible by strategic long-range FX .
USD/JPY Historical Data
There have been several defined structural cycles in USD/JPY over the last 10 years, all of which have correlated closely to changes in policy direction and global yield dynamics.
The 2021 near ¥102 low in a pair was the camel’s-back breaking point for a multi year stretch where Japan’s ultra loose monetary settings could coexist with mild U.S. inflation, keeping yield differentials historically sparse.
The terrain shifted dramatically from 2022 to 2024, when the Federal Reserve embark on its most aggressive tightening cycle for decades. Meanwhile, the Bank of Japan supported its YCC system by keeping long-term Japanese bond yield near zero. This unprecedented split also led to one of the fastest depreciation in the history of the yen, which saw US D/JPY break above ¥160 – a level not seen since 1990.
In 2025, the pair entered into a long period of consolidation within ¥150 – 155. Markets started to reconsider the past of Fed rate cutting and to wonder whether the Bank of Japan might be able to gingerly step back from ICC without jolting domestic markets.
However, although under consolidation, volatility remained high, exposing how vulnerable the pair remains against policy tweaks, along with yield differentials and intervention whisper from Tokyo.
This historical sequence points to a comment theme in USD/JPY: policy divergence and real yield spreads, as well as pricing of central bank measures, continue to exert themselves as prime movers — and they don’t look like abating anytime soon.
USD/JPY Buy or Sell
Reasons to stay bullish:
- U.S. – Japan yield gap wide and persistent.
- Sluggish Japanese consumption and investment patterns.
- Bank of Japan caution about tightening.
- Strong U.S. economic resilience.
Risks to the bullish view:

- Unexpected Bank of Japan rate hike
- Japanese FX intervention (historically at ¥ (152 – 155)
- A recession or policy pivot that drives U.S. yields lower
Best Time to Trade USD/JPY
Roller characterizing USD/JPY as among the most consistent currency pairs when it comes to intraday liquidity and volatility cycles, timeliness is critical in the execution equation.
Tokyo-London overlap remains the prime trading window
The most liquid and strategically advantageous period to trade USD/JPY occurs during the Tokyo-London session overlap.
15:00 – 21:00 (GMT +8)
During the window:
- Interbank liquidity is highest on the trading nights: leading to tighter spreads and more clean price action.
- News flow picks up, key economic releases from both Japan, Europe and the U.S. indirect to dominate near term direction.
- Volatility is becoming larger, and this would be a perfect condition for breakout, momentum and event-drives strategies.
Secondary Opportunities
Japanese early session (08:00 -11:00 GMT+8), which is great for trading off BOJ headlines, Japanese data releases or if market is “sentimented“ by equity flows (especially Nikkei futures).
US session (21:00 – 02:00 GMT +8), which is good for high-impact U.S. data (NFP, CPI, Fed decisions), although spreads can widen a little bit during non-peak hours.
Professionals often time trading plans around these windows in order to take advantage of liquidity clusters, volume cycles and policy-driven catalyst – all of which are especially pronounced when compared with other G10 pairs when it comes to USD/JPY/
Frequently Asked Questions
How to calculate pips in USD/JPY?
For yen pairs, 1 pip = 0.01, for example: 154.20 = 20 pips
How to trade USD/JPY?
Common strategies include trend following, breakout setups, carry trade (taking advantage of yield differentials) and mean reversion near intervention levels.
What is USD/JPY?
The exchange rates showing how many Japanese yen (JPY) are needed to buy one U.S. dollar (USD).
What time does USD/JPY open?
Forex market runs 24 hours, starting Monday 6:00 AM (GMT +8).

 AAPL
AAPL MSFT
MSFT META
META ^NDX
^NDX BTC-USD
 XRP-USD
 SUZLON.NS
 INR=X
INR=X EURUSD=X
 JPY=X
JPY=X CAD=X
CAD=X