
- - Despite bleak-looking long-term Polkadot price predictions, there may be opportunity for short-term dip buyers.
- - The article presents Polkadot price predictions for 2026, 2030 and 2040.
Table of Contents
- Live Chart
- Polkadot Price Prediction 2026
- Polkadot Price Prediction 2030
- Polkadot Price Prediction 2040
- DOT Technical Analysis & Market Trends
- Can Polkadot Reach $1,000?
- FAQ
- What is the long-term price prediction for Polkadot?
- How high can Polkadot price go in the next bull run?
- Why is Polkadot price fluctuating today?
- Is Polkadot a good investment for 2025–2030?
Those who had bullish Polkadot price predictions before 2025 have had their forecasts upended by the DOT token’s poor performance when compared with its peers. Polkadot’s steady decline from its November 2021 highs to a fraction of its prior high of $55.90 has stunned many and left its HODLers in utter disbelief.
DOT’s poor performance is a combination of factors. Apart from the crypto winter that has seen a massive selloff in November and early December 2025, the token’s inability to attract the attention of enterprise use cases in a crowded ecosystem has left its previous 2025 price predictions for Polkadot floundering.
Live Chart
- Zoom
- Type
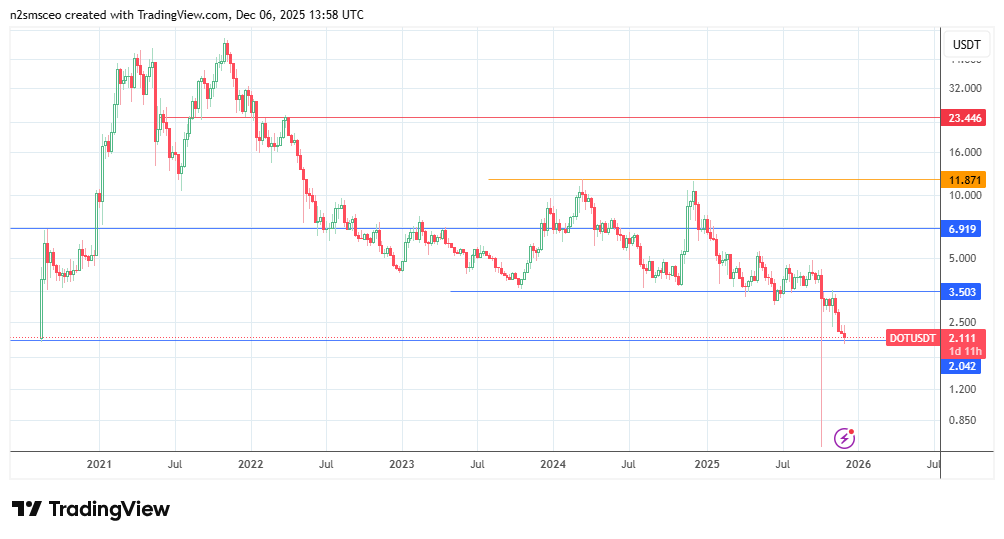
The live chart of DOT/USDT shows that the pair currently trades at $2.11 per token, a far cry from its November 2021 highs. What is the Polkadot crypto price prediction for subsequent years? Is it now time to buy the dip?
Polkadot Price Prediction 2026
What are the Polkadot price predictions for 2026? Institutional forecasts are hard to come by, and users have to rely on forecasts from retail-focused blogs and crypto exchanges. With the price of Polkadot so heavily discounted at the moment, what do the Polkadot price predictions 2026 look like?
Polkadot’s community has approved changes to the tokenomics of the DOT token. There is a new supply cap, and a new stepped-down inflation model has been created. While the total supply cap has been set at 2.1 billion DOT tokens, the inflation step-down period is 2 years, with the first step-down scheduled for March 2026.
Changelly’s highest Polkadot price prediction for 2026 is $2.22, with the DOT token expected to reach that level in January 2026. Binance’s consensus page, which takes price predictions from the public (it is not Binance’s official page), has a 2026 Polkadot price prediction that averages the same as Changelly’s. The $2.21 average Polkadot price prediction is more of a sentiment view and not a specific price forecast.
The actual price of the DOT token in 2026 will depend primarily on market reaction to the kick-in of the inflation step-down and its scaling plan.
Polkadot Price Prediction 2030
All of the Polkadot price predictions for 2030 come from retail-focused sources: crypto exchanges and outlets serving the retail market. Institutions are not concerned with crypto tokens other than Bitcoin, Ethereum, Ripple, or Solana. Tokens such as DOT will not get an institutional look-in at this time.
InvestingHaven has an aggressive target for Polkadot’s long-term price. A $36 price by 2030 is the Polkadot price prediction of this provider.
Changelly projects an average price of $14.33 by 2030, with a range of $13.94 to $16.43. YouHodler provides some flexibility for the DOT token to trade between $1.5-$3.0 by 2030 in a bear-case scenario, while its mid-range sees DOT trading at $7-$15 against the US Dollar (USD) or USDT.
Kraken and Coinbase are crypto exchanges that use predictive tools to provide long-term crypto price forecasts. Kraken’s model calls for a $2.73 price, based on a 5% CAGR. Coinbase uses a growth-based assumption rather than a specific price forecast.
Polkadot Price Prediction 2040
Polkadot price predictions for 2040 are highly speculative due to the long-term nature of this outlook period. Kraken’s calculator tool has a Polkadot price prediction of $4.45 by 2040, using a conservative single-digit outcome prediction that is based on a 5% annual change. This still represents a good upside potential from the current Polkadot price.

Flitpay has a more optimistic Polkadot price prediction, predicting a $59 average for 2040. Changelly has probably the most aggressive price forecast; so aggressive that it will not be named here. However, it calls for a 4-digit price, which is incredibly high considering the current Polkadot price.
DOT Technical Analysis & Market Trends
A look at the long-term chart for Polkadot shows that the DOTUSDT pair is in a downtrend. Price is currently testing support at 2.042, last seen as a the multi-year low of August 2020. A breakdown of this support unlocks access to the recent spike low of October 2025 at 0.633. However, the 27% Fibonacci extension of the December 2024 – June 2025 downswing at 0.859 forms the intervening barrier.

On the flip side, a defence of the current support by the bulls allows for a retracement bounce that aims for 3.503 initially, being the prior low of October 2023 and August 2025. A further push north targets 7.484, with 5.000 serving as a psychological barrier.
Can Polkadot Reach $1,000?
The Polkadot long-term price predictions do not call for a $1000 price at the medium- or long-term horizons. A price spike from the current values to $1000 is a tall order for a struggling token. Those who presently hold DOT tokens would be better served by sticking to achievable Polkadot coin price predictions and watching how the price responds to the latest resolutions.
FAQ
What is the long-term price prediction for Polkadot?
The long-term Polkadot price prediction is for a limited upside move, betting on a positive response to the March 2026 inflation step-down.
How high can Polkadot price go in the next bull run?
There is a potential for a 100% gain in the next bull run, given the location of the current price and the prevailing resistance barriers.
Why is Polkadot price fluctuating today?
Lack of demand for the DOT token and the general market downturn have caused a downward move on the DOT/USDT pair in December 2025.
Is Polkadot a good investment for 2025–2030?
Polkadot has the potential to be a good investment for 2030 if the token can get a positive lift from the proposed inflation step-down that kicks off in March 2026.

 AAPL
AAPL  MSFT
MSFT  META
META  ^NDX
^NDX  BTC-USD
  XRP-USD
  SUZLON.NS
  INR=X
INR=X  EURUSD=X
  JPY=X
JPY=X  CAD=X
CAD=X