
- - Natural gas price predictions from 2026 all the way to 2040 are available from a variety of trusted sources. These are presented in this article.
- - Get sound technical analysis from the natural gas charts to understand the state of spot and futures prices.
Table of Contents
- Live Chart
- Natural gas price prediction 2026
- Natural gas price prediction 2030
- Natural gas price prediction 2040
- Short-Term Technical Analysis (Weekly View)
- Global Supply & Demand Drivers
- FAQ
- Will natural gas prices go up in the near future?
- Why is natural gas falling in the current market?
- What is the Natural gas price prediction for 2026?
- How can I trade natural gas on MCX?
This article will examine natural gas price prediction patterns from institutional firms and retail-focused outlets, with special emphasis on Henry Hub and MCX natural gas price predictions.
Natural gas spot and futures prices have shown a recovery from the November 2024 lows following the decision by the Trump administration in the US to expand LNG exports. The energy-correlated assets such as the USDCAD and CADJPY have also shown some volatility that have provided trading opportunities since then.
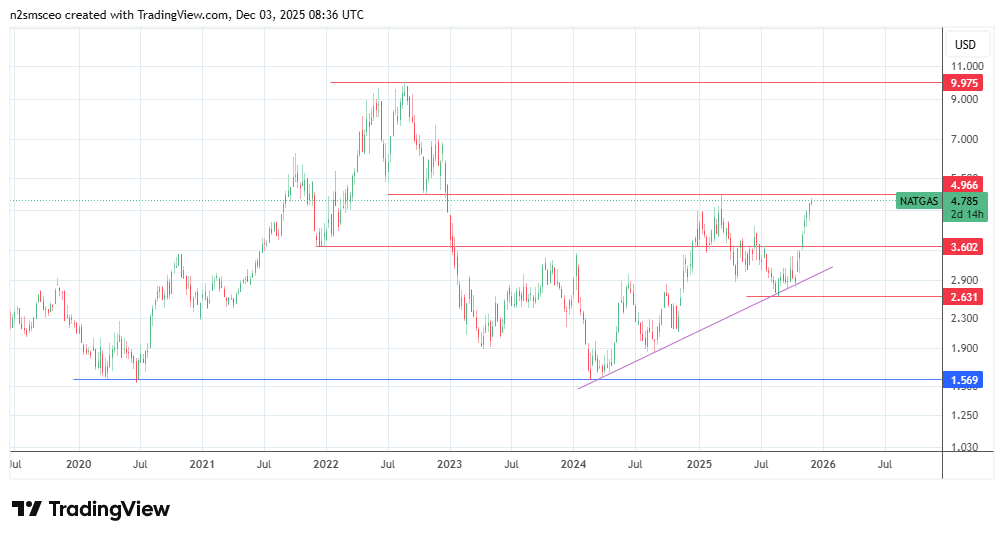
The live chart below shows the weekly natural gas spot price chart. Natural gas futures price predictions can draw some inferences from the natural gas futures charts, which must account for the expiration of futures contracts in the price action.
Live Chart
Natural gas price prediction 2026
The US Energy Information Administration’s latest short-term energy outlook (STEO) puts a Henry Hub natural gas price prediction for 2026 at $4.00/MMBtu. The 16% increase over the 2025 projections is due to projected strengthening of liquefied natural Gas export growth amid relatively flat production levels.
Fitch Ratings provided a long-term price outlook in March 2025 via NAGA. Its updated price outlook has called for a Henry Hub average of $3.89/MMBtu. This is also an upgrade from a previous lower projection.
Goldman Sachs has a more bullish stance on natural gas prices for 2026. Its 20276 Henry Hub call made in October 2026 is $4.60/MMBtu. The investment bank sees this price driven by power demand, increased LNG exports, and slower supply growth.
Standard Chartered also published a research note in October 2025 on the popular oil and gas web portal Rigzone. It has called for Henry Hub natural gas futures price prediction of $4.03/MMBtu in 2026 and $4.40/MMBtu in 2027. Standard Chartered pins this outlook on rising power demand from domestic data centres used for AI work and on an increase in LNG exports. It, however, sees prices being capped eventually by LNG oversupply.
In summary, the US natural gas price predictions for 2026 from institutional sources puts the 2026 Henry Hub price range at $3.8 – $4.6/MMBtu.
Natural gas price prediction 2030
How about MCX natural gas price predictions for 2030? MCX natural gas is quoted in Rupees per MMBtu and is designed to track international gas pricing benchmarks such as Henry Hub.
To derive any 2030 natural gas price predictions, the following formula is used:
MCX NG price ≈ (International gas price in $/MMBtu + LNG premium) × USD/INR ± local basisNo institution has published a target in Rupees.
No institutions have published any MCX price forecasts for 2030. Therefore, the Henry Hub natural gas price predictions for 2030 represent the most reliable long-term price decks available. For this, we turn to Deloitte, Fitch Ratings, and Incorrys.
Fitch Ratings did not mention a specific price target for 2030. Instead, it referred to the $2.75/Mcf price it put out in its December 2024 North American natural gas outlook as its Henry Hub through-the-cycle price. This number is its long-term natural gas price prediction.
Energy data firm Incorrys projects a Henry Hub natural gas price of $3.65/MMBtu in 2030. The 2030 price call represents a 23.6% increase over the 2023 levels.
A summary of Deloitte’s long-term gas outlook forecasts a $4.40 Henry Hub natural gas spot price in 2030. A NAGA article also quotes Deloitte as calling for a $5.40/Mcf price in 2030, representing a more bullish call.
Natural gas price prediction 2040
Here are the natural gas price predictions for 2040 from a government agency (EIA) and other sources.
The US Energy Information Administration has forecast an annual energy outlook of $4.20/MMBtu for 2040, according to NAGA.
Deloitte also provides its own forecast for 2040, predicting a natural gas price of $6.35-$6.55/MMBtu.
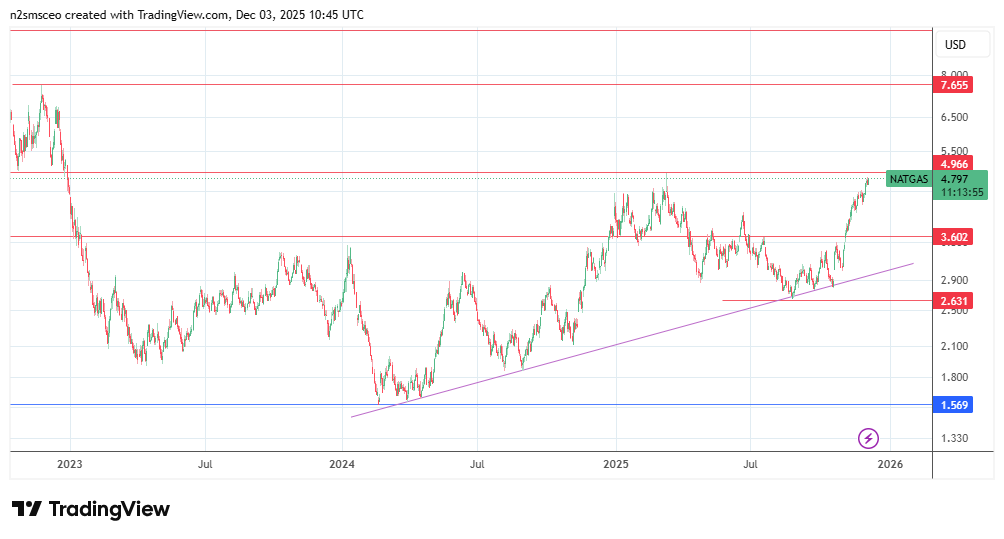
Short-Term Technical Analysis (Weekly View)
The weekly NATGAS chart shows a recovery from the 2024 low at 1.569, with the price poised to test the resistance formed by the March 2025 top at 4.966. A break of this level continues the advance, with the October 2021 high at 6.427 and the November 2022 high at 7.655 serving as new upside targets.
However, rejection at the current resistance suggests a pullback towards the 3.602 support level, formed by the December 2021 low. Below this level, 2.631 forms the next downside barrier, but this will only become visible if the trendline is degraded.

Global Supply & Demand Drivers
The interplay between supply and demand determines the pricing of natural gas contracts. Therefore, knowledge of global supply and demand drivers is indispensable for anyone wishing to trade natural gas on a spot or futures basis.
Demand Drivers
- Power generation: The most significant demand driver, as natural gas powers electricity plants in Europe and North America.
- Industrial demand: key industries involved in the manufacture of fertilizer, petrochemical plants, cement, metal industries, and refineries. This demand driver is highly price-sensitive and is tightly linked to demand from China and India. Industrial demand accounts for 45% of recent demand spikes.
- Heating for Buildings: Commercial and residential heating and cooking demand play a significant part in pricing, especially during winter.
- AI and Data Centres: The unbelievable explosion in demand for data centres to power AI is set to outstrip available power supply, even in countries with high energy capacity. Construction of natural gas plants to bridge this need is a new growth area that will only grow, stretching into the mid-2030s.
Supply Drivers
- LNG Liquefaction Capacity: This is the most significant lever for supply. The International Energy Agency projects new LNG liquefaction capacity to hit 300 billion cubic metres (bcm) per year by 2030, served mainly by the US and Qatar (70%). Mapping sources indicates a strong push to monetize gas resources amid the ongoing war in Ukraine.
- Upstream production from US shale and Middle East sources.
- Climate policy and ESG-driven pressure
- Energy transition and competition from “greener” energy sources.
FAQ
Will natural gas prices go up in the near future?
The current market fundamentals indicate that demand pressures will increase in the near future, driving prices higher.
Why is natural gas falling in the current market?
Natural gas is testing resistance at 4.966. Any price drop is a minor correction from a failed resistance break.
What is the Natural gas price prediction for 2026?
Most institutions have set prices within the $4.00 – $4.60 price range.
How can I trade natural gas on MCX?
To start trading natural gas on the Multi Commodity Exchange of India (MCX). there are a few conditions to be met. You must open a commodity trading account with a registered broker and complete all KYC requirements. Check your broker platform for MCX natural gas futures contract, then deposit funds to start trading. You can also get smaller natural gas contracts that start at 250 MMBtu.

 AAPL
AAPL  MSFT
MSFT  META
META  ^NDX
^NDX  BTC-USD
  XRP-USD
  SUZLON.NS
  INR=X
INR=X  EURUSD=X
  JPY=X
JPY=X  CAD=X
CAD=X