

- Choppy markets occur when price moves sideways with no clear trend, showing balance between sellers and buyers.
- Traders can spot sideways action using indicators like RSI, ADX, and Bollinger Bands, while avoiding common mistakes like overtrading or ignoring risk.
- Success in choppy conditions relies on range-based strategies proper risk management and waiting for clear trends before taking major positions.
Table of Contents
- What Defines a Choppy Market
- Snapshots of Choppy Markets:
- Key Indicators to Spot Sideways Price Action:
- Common Mistakes Traders Make in Uncertain Conditions
- Strategies to Profit When Trends Are Weak or Nonexistent:
- Mean Reversion Strategy for Choppy Market:
- Range Trading Strategy for Choppy Market:
- Scalp Trading Strategy for Choppy Market:
- Risk Management Techniques for Choppy Markets
- When to Avoid Trading and Wait for Clear Trends
- How can traders identify choppy market conditions?
- What strategies work in sideways markets?
- How to minimise losses during volatile or uncertain price action?
- What indicators help confirm the end of a choppy market?
Trading in choppy markets means that there is no clear direction, which is confusing for traders and can lead them to fall into a false breakout or overtrade. During choppy markets, the price action is moving sideways, making it difficult to anticipate the potential direction.
This article explains how to spot choppy markets, avoid common mistakes, use effective strategies, and manage risk until a strong trend appears.
What Defines a Choppy Market
A choppy market occurs when an asset’s price moves with no clear direction. It happens when sellers and buyers are in equilibrium. which means that buyers and sellers have the same strength, creating balance rather than momentum. During periods of high liquidity, when neither bears nor bulls can take control, the market often becomes choppy.
The key characteristics of the choppy markets are obviously on the chart. The candelsticks show long wicks, false breakout, and messy price action. Price stays trapped between support and resistance levels for extended periods. That’s occurring due to a large number of orders existing, which means high liquidity but low movement, then the price struggles to break out of its range.
Snapshots of Choppy Markets:
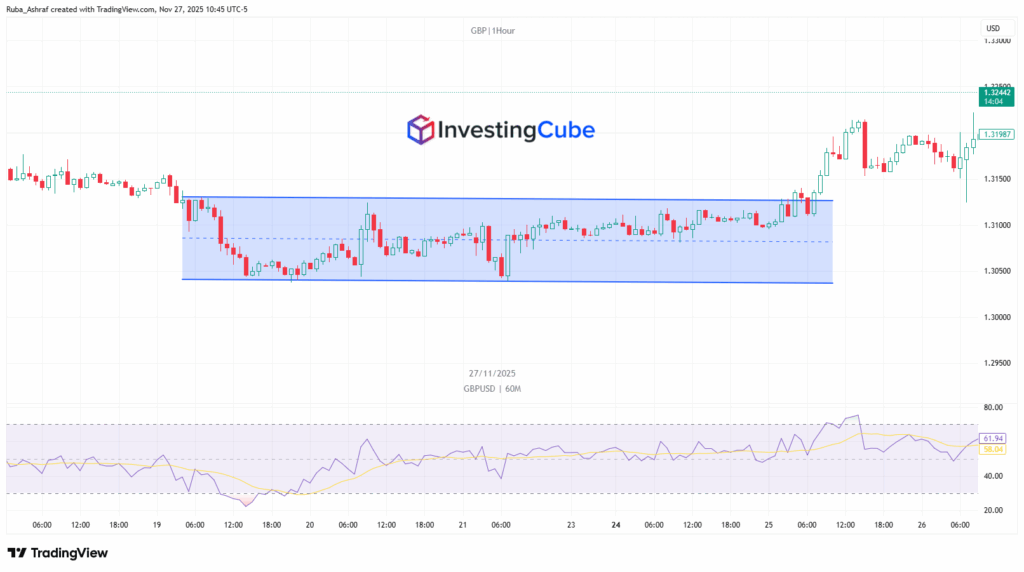
The GBP/USD chart shows that the price action has been moving between resistance and support levels for an extended period without a clear direction. Once the price action successfully broke out above the resistance level, the direction changed.

Looking at the chart of Applovin Corporation stock shows that the market was choppy. At this time, the stock was trading sideways, trapped between resistance and support levels without a clear trend.
If you look at the RSI indicator on both previous examples, you will notice that during sideways (choppy) market conditions, the RSI stayed at or near the 50.00 mark. This confirms that in a choppy market, neither buyers nor sellers are in control. They are in equilibrium.
These examples guide us toward an important point: the key indicators to look for when identifying sideways price action.
Key Indicators to Spot Sideways Price Action:
To spot sideways price action during choppy market conditions, you can use the technical indicators mentioned below:
- Relative Strength Index (RSI):
- When the price action becomes sideways, the RSI oscillator typically hovers near the 50 level. This means that neither buyers nor sellers are in control.
- Above the 70 level, the market is considered overbought, indicating the price may be too high and potentially pull back.
- Below the 30 level, the market is considered oversold, indicating the price may be too low and potentially rebound.
- Bollinger Bands: show how volatile the market is and help identify potential reversal or breakout points.
- It indicates a choppy market when the bands narrow tightly, and the price moves sideways between the upper and lower bands without a clear direction. This squeeze shows low volatility and no clear trend, meaning buyer and seller are evenly matched
- Average Directional Index (ADX):
- It indicates a choppy or sideways market when the ADX value stays below 20 or sometimes below 25. This means the trend is weak, and neither buyers nor sellers have momentum, resulting in low volatility and unclear direction.
Common Mistakes Traders Make in Uncertain Conditions
During uncertain conditions, a lot of traders can not control their emotions due to the confusing market. This leads traders to emotional trading, such as panic selling, overtrading, trading without a plan, and failing to use risk management tools. This behavior often leads to significant losses rather than just temporary volatility.
| Common Mistake | What It Is | The Result |
| Trading without stop-losses | Entering trades without setting a level to limit losses with a suitable percentage to lose per trade, according to your overall equity. | Leads to large, unexpected losses and blown accounts. |
| Ignoring proper position size | Using too big or too small lot sizes without following the rule of risking only1-2% of your total equity per trade. | Causes high-risk exposure or small, ineffective gains. |
| Ignoring the risk-reward ratio | Taking trades without checking if the potential reward is worth the risk. | Results in poor long-term profitability and inconsistent returns. |
| Overtrading | Taking too many traders out of emotion. | Increases mistakes, fees, stress, and unnecessary losses |
Strategies to Profit When Trends Are Weak or Nonexistent:
The three most suitable strategies during choppy markets, when trends are weak or nonexistent, are:
- Mean Reversion Strategy.
- Range Trading Strategy.
- Scalp Trading Strategy.
Mean Reversion Strategy for Choppy Market:
This strategy uses the Relative Strength Index (RSI) or Stochastic Oscillator. These indicators help identify overbought and oversold conditions. When the traded financial instrument reaches its extreme level, it may snap back to its average price (mean). At this time, traders can anticipate the potential direction and set their positions accordingly.
Range Trading Strategy for Choppy Market:
We can conclude this strategy in four words: Buy low, sell high. You only need to identify the lower support level and the higher resistance level of the trading range. Then plan to buy near support and sell near resistance. To learn more about what Buy Low is, check our article Buy the Dip.

For proper risk management, you should place your stop-loss order outside the range boundaries to avoid false breakouts and take profits at the opposite boundary.
Scalp Trading Strategy for Choppy Market:
Entering a small and quick position, taking advantage of the tiny price movements within the range when the market lacks direction.
Risk Management Techniques for Choppy Markets
- Focus on protecting your equity rather than maximizing your profits. Stick to your trading plan to avoid emotional trades.
- Set a proper position sizing, follow the rule of risking only1-2% from your total account balance per trade.
- Always use risk management tools such as stop losses and take profit orders.
- It’s not mandatory to enter positions when the market is messy; sometimes, it needs you to stand away until a clear trend emerges.
When to Avoid Trading and Wait for Clear Trends
- Avoid trading during major news events because it can cause extreme volatility, which can lead to significant losses if the market moves against your position.
- Avoid trading during an illiquid market as spreads tend to be wider. This can increase trading costs and risk.
- Stepping away when you feel stressed about the market to avoid any emotional decisions.
How can traders identify choppy market conditions?
Traders can identify choppy markets by spotting sideways price movements, frequent reversals, tight trading ranges, low ADX values, and RSI near 50.
What strategies work in sideways markets?
Range trading, mean reversion, scalping, Bollinger band bounces, and support/resistance bounces work well in sideways. Using this strategy will allow traders to capitalize on predictable oscillations rather than trending movements.
How to minimise losses during volatile or uncertain price action?
Use risk management tools such as stop-loss, proper position size, risk-reward ratios, and avoid overtrading. Stepping away until the market has a clear direction and identified ranges.
What indicators help confirm the end of a choppy market?
When the ADX indicator is rising above 30, the RSI is moving away from the 50 level, the Bollinger band is widening, and also when the price action performs higher highs or lower lows.

 AAPL
AAPL MSFT
MSFT META
META ^NDX
^NDX BTC-USD
 XRP-USD
 SUZLON.NS
 INR=X
INR=X EURUSD=X
 JPY=X
JPY=X CAD=X
CAD=X