
- The cryptocurrency market has had a memorable ride in 2025, rising to historic highs. On-chain data tells us much about this, including emerging trends in institutional appetite for digital coins.
The year 2025 has cemented institutional involvement as the defining force in crypto markets. Understanding this trend requires looking beyond traditional market metrics. We must analyze on-chain data, the transparent, immutable record of every transaction. This data provides unparalleled insight into the accumulation strategies of large, professional investors.
What is On-Chain Data?
On-chain data includes all transactions and activities recorded on a public blockchain, and are easily accessible to the public. It covers transaction amounts, wallet balances, smart contract activities and money moving in/out of exchanges. Looking at this data can help in predicting price changes by showing what investors are doing.
Institutional Accumulation Trends in 2025
The trend in 2025 has been characterised by aggressive institutional accumulation, despite periods of intense price volatility. This buying pressure has fundamentally shifted market dynamics. The key drivers are the expansion of Spot Bitcoin ETFSs and the emergence of Digital Asset Treasury Companies (DATCos).
Around the mid-year, company treasuries increased their crypto positions. Strategy (formerly MicroStrategy) bought 257,000 BTC in 2024, and this trend went on into 2025. Total company crypto holdings are now over $6.7 billion. New companies like Windtree Therapeutics put $520 million into BNB. By October, accumulation peaked. Addresses bought 214,069 BTC in 30 days ending November 5. Their average cost sits at $64,000 per BTC. This occurred amid a flash dip below $100,000.
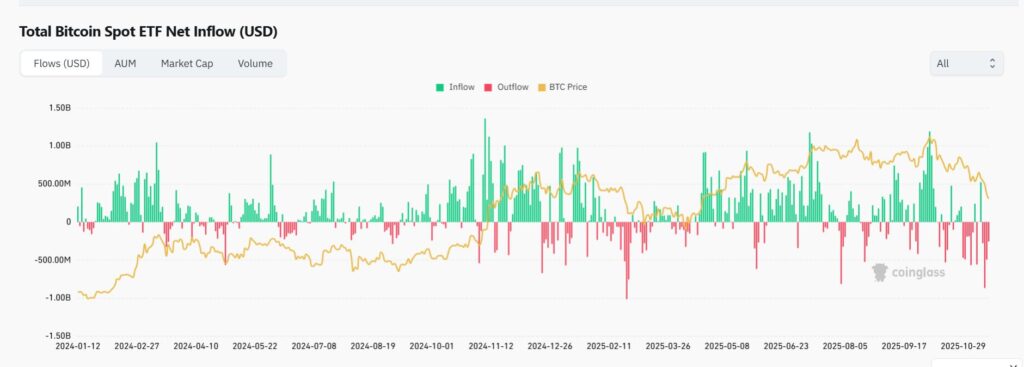
A screen grab of BTC spot ETF AUM trends in 2025. Source: Coinglass
Chainalysis’ 2025 Global Adoption Index shows how much institutions have grown. On-chain activity in North America grew 49% year-over-year. The U.S. ranks second in large transaction value received, behind India. This sub-index tracks transfers over $1 million.
Ark Invest mentioned that institutions counteracted sales by large holders this year. Public companies and ETFs absorbed the excess flow. On-chai data confirms this strong institutional commitment. For Bitcoin, CryptoQuant data showed rising accumulation and sustained declines in exchange reserves throughout the year.
U.S. spot Bitcoin ETFs hold 1.33 million BTC as of November 15,2025. This marks a surge from zero at launch in January 2024. BlackRock’s IBIT ETF alone manages nearly $100 billion in assets. Such holdings absorb selling pressure from long-term holders.
Strategy Stock Price Live Chart
- Zoom
- Type
For Ethereum, on-chain data indicates long-term wallets accumulating, reaching a record 27 million ETH by November 2025. The asset is trading near the holders’ cost basis, according to analyst Tom Lee. This accumulation suggests confidence in a coming supercycle for Ethereum.

The growing use of liquid staking tokens and institutional interest in multi-asset ETFs, highlighted in the Sygnum Bank Future Finance 2025 Report, further diversified this institutional demand beyond just the two assets.
Q4 2025 Trajectory and Early 2026 Outlook
Coinbase Institutional’ s Q4 report suggests positive suggests positive trends, such as liquidity from two possible Federal Reserve rate cuts potentially putting $7 trillion into risk assets. Digital asset treasuries hold 3.5% of Bitcoin’s supply, while ETH-focused firms control 3.7%. These act as steady buyers.
Meanwhile, on-chain data suggests resilience. Current whale accumulation correlates with price surges, per 2023-2025 analysis. However, risks include possible liquidations and tighter economic conditions. The October shakeout advises being careful going forward. However, policy advancements like the GENIUS Act for stablecoins support growth.
What drove 2025 crypto ETF inflows?
Regulatory approvals and President Donald Trump’s policies accelerated flow to about $7 billion, with BlackRock leading.
How have Bitcoin ETFs influenced the trend in 2025?
Spot Bitcoin ETFs caused massive, structured capital inflows, helping drive their total net assets to a record high of almost $150 billion in Q4 2025.
What is the outlook for the market trajectory into early 2026?
The continuous accumulation points to a sustained, gradual growth trajectory, with institutions holding an estimated 20% of total Bitcoin supply by the end of 2026.

 AAPL
AAPL  MSFT
MSFT  META
META  ^NDX
^NDX  BTC-USD
  XRP-USD
  SUZLON.NS
  INR=X
INR=X  EURUSD=X
  JPY=X
JPY=X  CAD=X
CAD=X